Windows Azure has some great built-in features. One that is particularly helpful is adding site uptime alerts to your website, so if your uptime is below a particular threshold, you can get inundated with emails until someone fixes your problem.
Adding site uptime alerts for a Windows Azure website isn’t completely straightforward however, as you need to perform some steps in two different areas. As such, after fiddling around a little, I decided to take some screenshots and post em online for you.. consider it my valentines day present.
Step 1 – Adding end points
The first step in configuring site uptime alerts is setting up a monitoring end point. Consider this the URL of your website that anyone\anything can “ping”. With end points, if the HTTP response is a 200, you’re OK. If a 400 level code is returned, then something is considered wrong. For my applications, I like to have 2 types of endpoints, one that’s basic and should simply display something, and one that tests some business logic.*
To setup an endpoint, go to the appropriate Azure Website in the Azure Management portal. Once within the website, go to the Configure tab, and scroll to the Monitoring section. Here, you can enter your end point URL’s that should be tested every 5 minutes (added bonus, constant activity will keep your website warm!).
You have three items to input, a name (something to benefit you when you look for these end points later on), the URL of your end point, and the geographic location\locations that you want to test from. Here, you can see that I chose my website login page as my end point, and California, Illinois and Virginia as my test locations (you only get up to 3 at this time).
Once done, be sure to click save at the bottom of the screen to commit your changes.
Step 2 – Setup your alert for your end points
Now that you have an end point setup to monitor, that particular URL will be tested once every 5 minutes. To trigger an alert on this activity, go to the Management Services section within the Windows Azure Management portal. This is the fourth last button on the bottom left of the navigation bar.
Within this area, choose “Add Rule” at the bottom of the screen to create a new management service alert. Doing so brings up a simple 2 step wizard. The first is to give your alert a name. The name itself can only be 32 characters long, so be concise, but go crazy with the description. Lastly, choose the type of service you are trying to setup an alert on. In this instance, choose Web Site and then choose the name of your Azure Website that you just setup the end point for. After giving a name\description\service, step 2 let’s you choose what your alert should be based on.
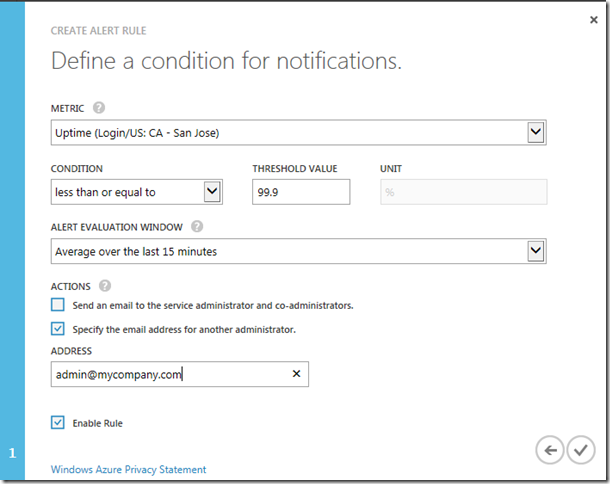
Below is an example of my uptime alert. For the metric field, you can choose Uptime for the particular geo-location. This means that you setup alerts to trigger from one particular location, rather than indicating the website is “down”. Here you can see that I chose to say if my uptime from California is below 99.9% for 15 minutes, send an email to my admin.
And that’s all there is to it!
*So for example, my basic test is my login page. If a user can’t hit that page, something’s rotten in Denmark. My other page, however, does some actions behind the scenes to test some logic for me. Perhaps my application relies on a database or 2, and\or some web services, and if these weren’t up, my site would be worthless. So for this page, I perform a series of database\service calls ensuring that I can connect, perform some basic function, etc. If any of these fail, I can return a 400 level HTTP response code, indicating that even though traffic is enabled to my site, some service\services are down.


No comments:
Post a Comment